![]()
Value charts were introduced by Stendahl and Helweg. I recommend reading their book ,“Dynamic Trading Indicators – Winning with Value Charts and Price Action Profile”; Mark Helweg & David Stendahl, John Wiley, 2002
They are usually implemented as candle type charts, but some people plot the closing values as a line.

You will see plenty of implementations of these out there in many charting packages, but be careful if you are comparing version against version. Most implementations use the basic raw calculation method which is clearly set out in the book. Stendahl also gives this out on his website www.ChartResearch.com.
Basically, value charts are a simple reframing of the price candle against a Relative Floating Axis determined from recent median value, then modified for recent volatility.
Value Chart Floating Axis = Average ((H+L/2),5); Volatility Unit = Average(Range,5)/5
This seems to be the most common implementation. However, the book then goes on to modify the basic formula by using a slightly different calculation for volatility as follows:
Floating Axis as before
Interval = Max (Close – Close(-1), High-Low) (nearly but not quite True Range)
Volatility Unit = Average(Interval,5)/5
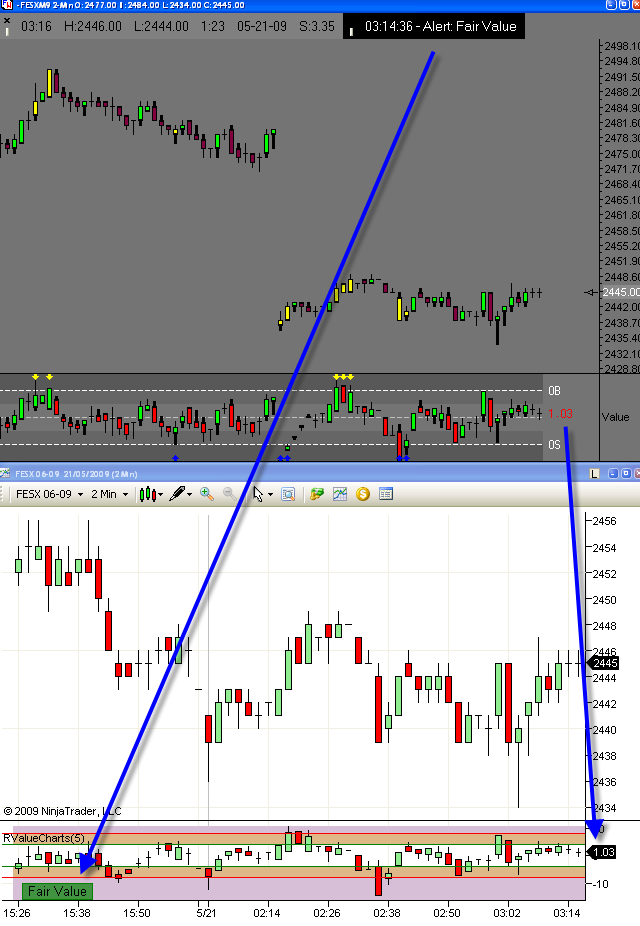
This is the approach embodied in the attached template. It seems to basically match another version that I have access to, as here.

But there are times when differences do show. Caveat emptor as usual. The book then goes on to discuss how you might modify the approach further by using what they call “Price Action Profile” and modifications based on standard deviations of recent price action. Read the book if you want to find out more.
In terms of usage, the template will plot an arrow when value goes beyond the 8 level, which is considered significantly overbought/sold (+/- 4 are considered moderately overbought/sold). It will also indicate whether value is considered “fair” (in between +/-4), or whether it’s in one of the other regions. (if this doesn’t do anything for you or doesn’t seem to work quite right, just delete the alerts). You can change the ma period in Line A of DYO “Value”.
That’s all I have time for. Hope it helps.
Sniffy
Last updated 05/21/2009