|
CME Report Changes 10/4/09 |
|
http://www.linnsoft.com/qa/a/166.htm Question Answer
As of Sunday, 10/04/2009, the CME has begun "unbundling" some
ticks/trades that were previously being sent as a single tick. From
inspecting charts of the ES, it appears that the net result of this change
is that approximately 2.5 times as many ticks or trades are being sent
on average, with a much smaller average size per trade. This does
not effect the volume, just the number of trades (more trades with a smaller
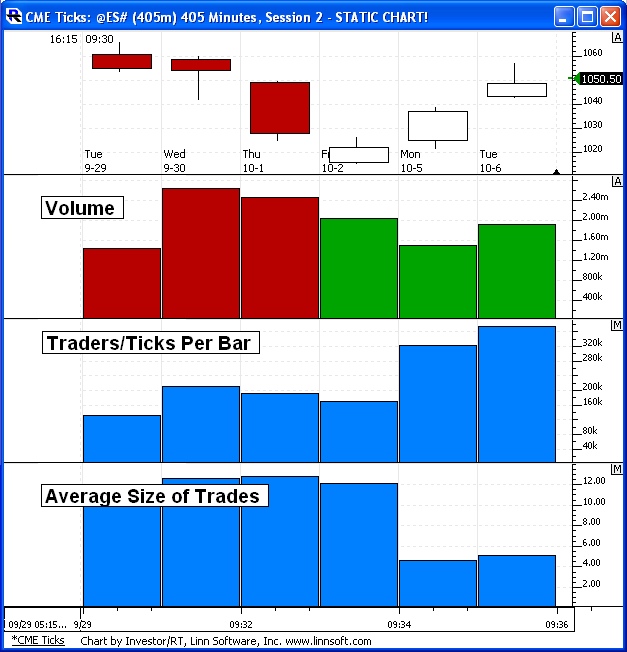
average size). So what does this mean for Investor/RT users? (Please keep in mind the following statements were made after observing just a short period of data before and after this change, and observing it only on the S&P e-mini contract ES.)
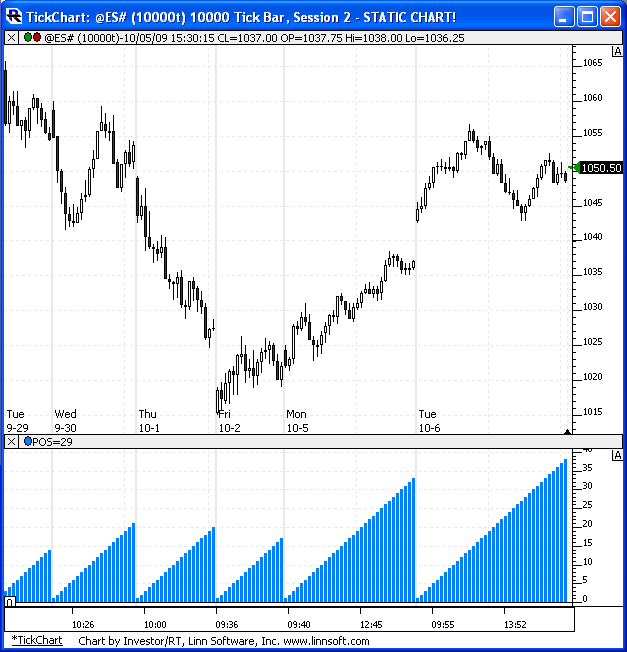
hese are daily bars (day session only). The first four days/bars are before the change, while the last two display the larger tick counts after the change. Notice the volume per day stays relatively consistent, while the number of trades per day increases from around 195k/day to around 370k/day. The lower pane shows the average size per trade, which drops from around 11.5 contracts per trade down to an average of 4.5 per trade. And below is a 10,000 tickbar chart (10,000 trades per bar):
You can see that the number of tickbars per day more than
doubled after the change went into effect. In order to get
the same number of bars per day as before, a user would need to multiply
his periodicity by something around 2.5. So a 100 tickbar chart would
change to a 250 tickbar chart, a 233 tickbar becomes 582 tickbar, a 377
tickbar becomes 942 tickbar, etc. However, I believe numbers like
233 and 377 were chosen because they are numbers in the Fibonacci sequence.
So if that is more important than maintaining the same number of bars as
before, it might make more sense to change 233 to 610 and 377 to 987. |